The Blast Radius
Every link and every router tested at once, and why graph theory makes it take 13 milliseconds
Michel Wijnberg
“What happens if I break this?” is a question about one thing. The question an architect actually needs answered is the inverse, and it is much harder:
Of everything in this network, which parts matter?
You cannot get there by clicking links one at a time. AS 200 in my lab has 275 links and 64 routers. Testing every single failure by hand is 339 experiments, and it needs redoing every time the topology changes.
So Osprey does all of them at once. What that buys is a shortlist: of 339 things that could fail, the handful that would actually cost you something. That is the difference between a resilience review you schedule for next quarter and one you run before approving a change.
Every link, every router, thirteen milliseconds
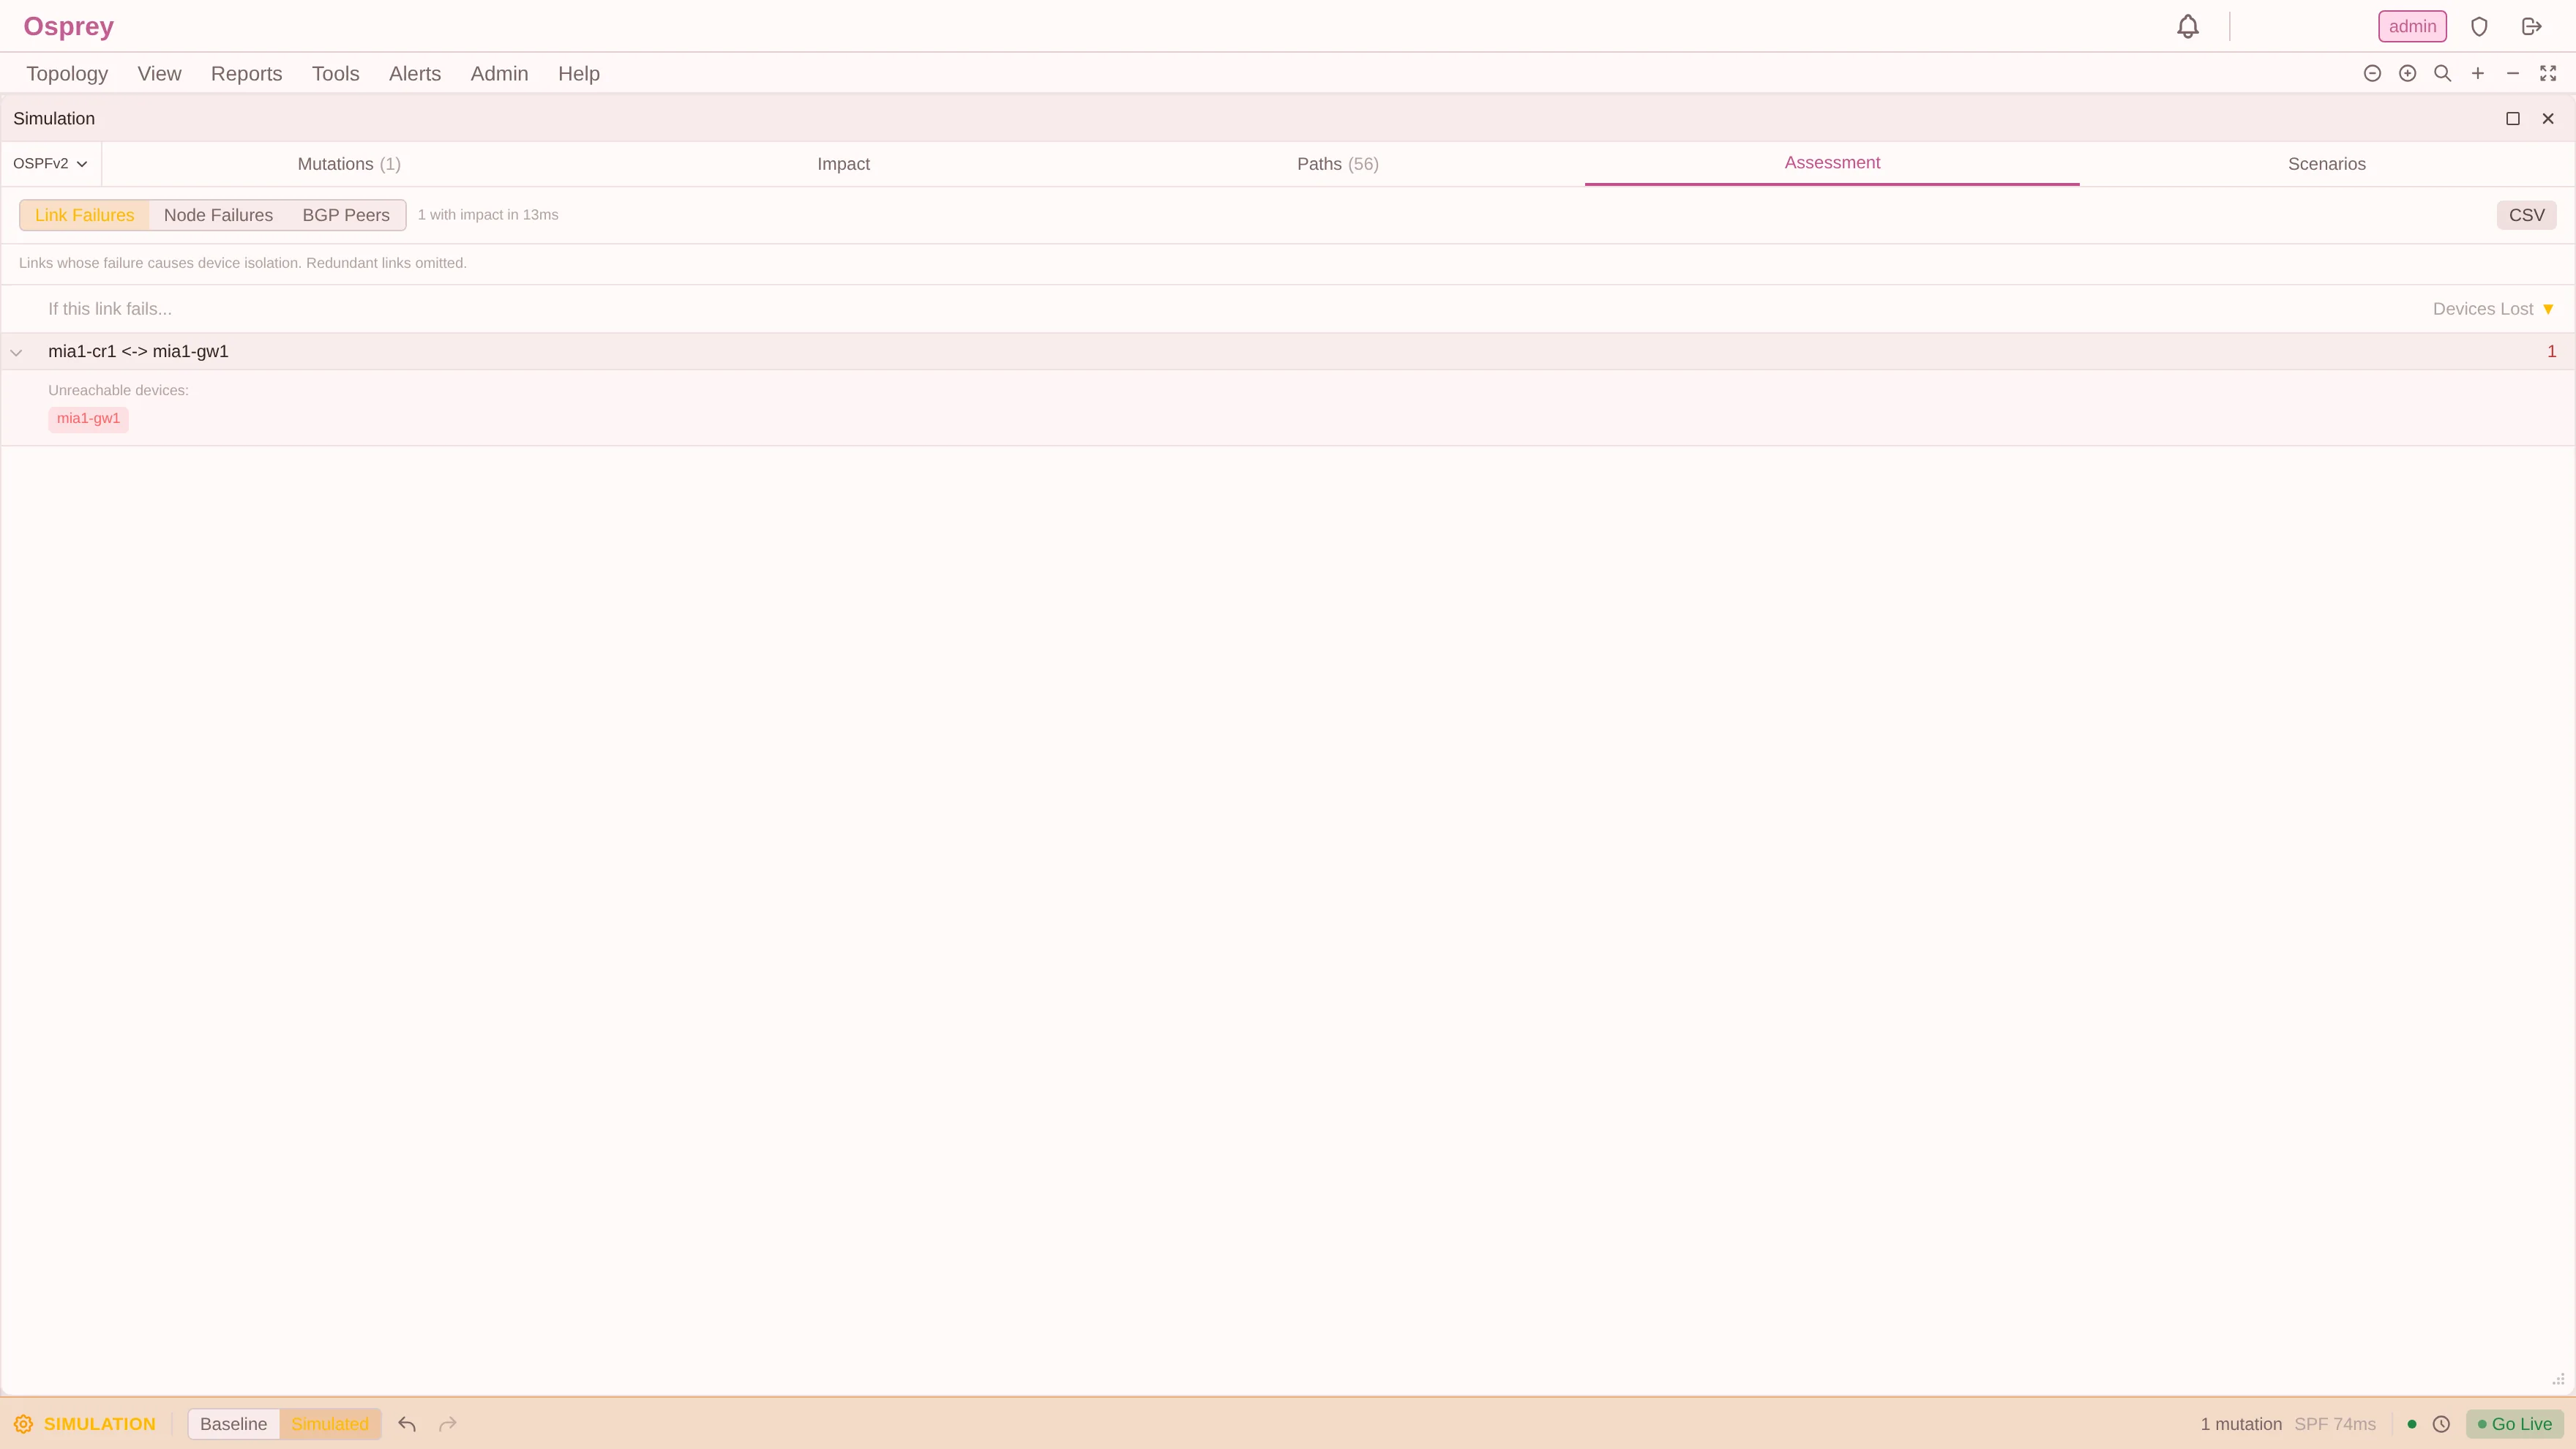
Read the header: “1 with impact in 13ms”, and underneath it the explanation of what was tested: “Links whose failure causes device isolation. Redundant links omitted.”
Every link in the tenant was assessed. Exactly one of them, mia1-cr1 ↔ mia1-gw1,
isolates anything at all, and what it isolates is one router: mia1-gw1. Switch the
toggle to Node Failures and the answer is the mirror image: of 64 routers, exactly
one (mia1-cr1) strands exactly one other.
That is the result an architect wants: not a list of 275 rows to read, but the statement that 274 of them are provably uninteresting.
The same weakness, found three times, through three protocols
The structural view of the same fact lives in its own report:
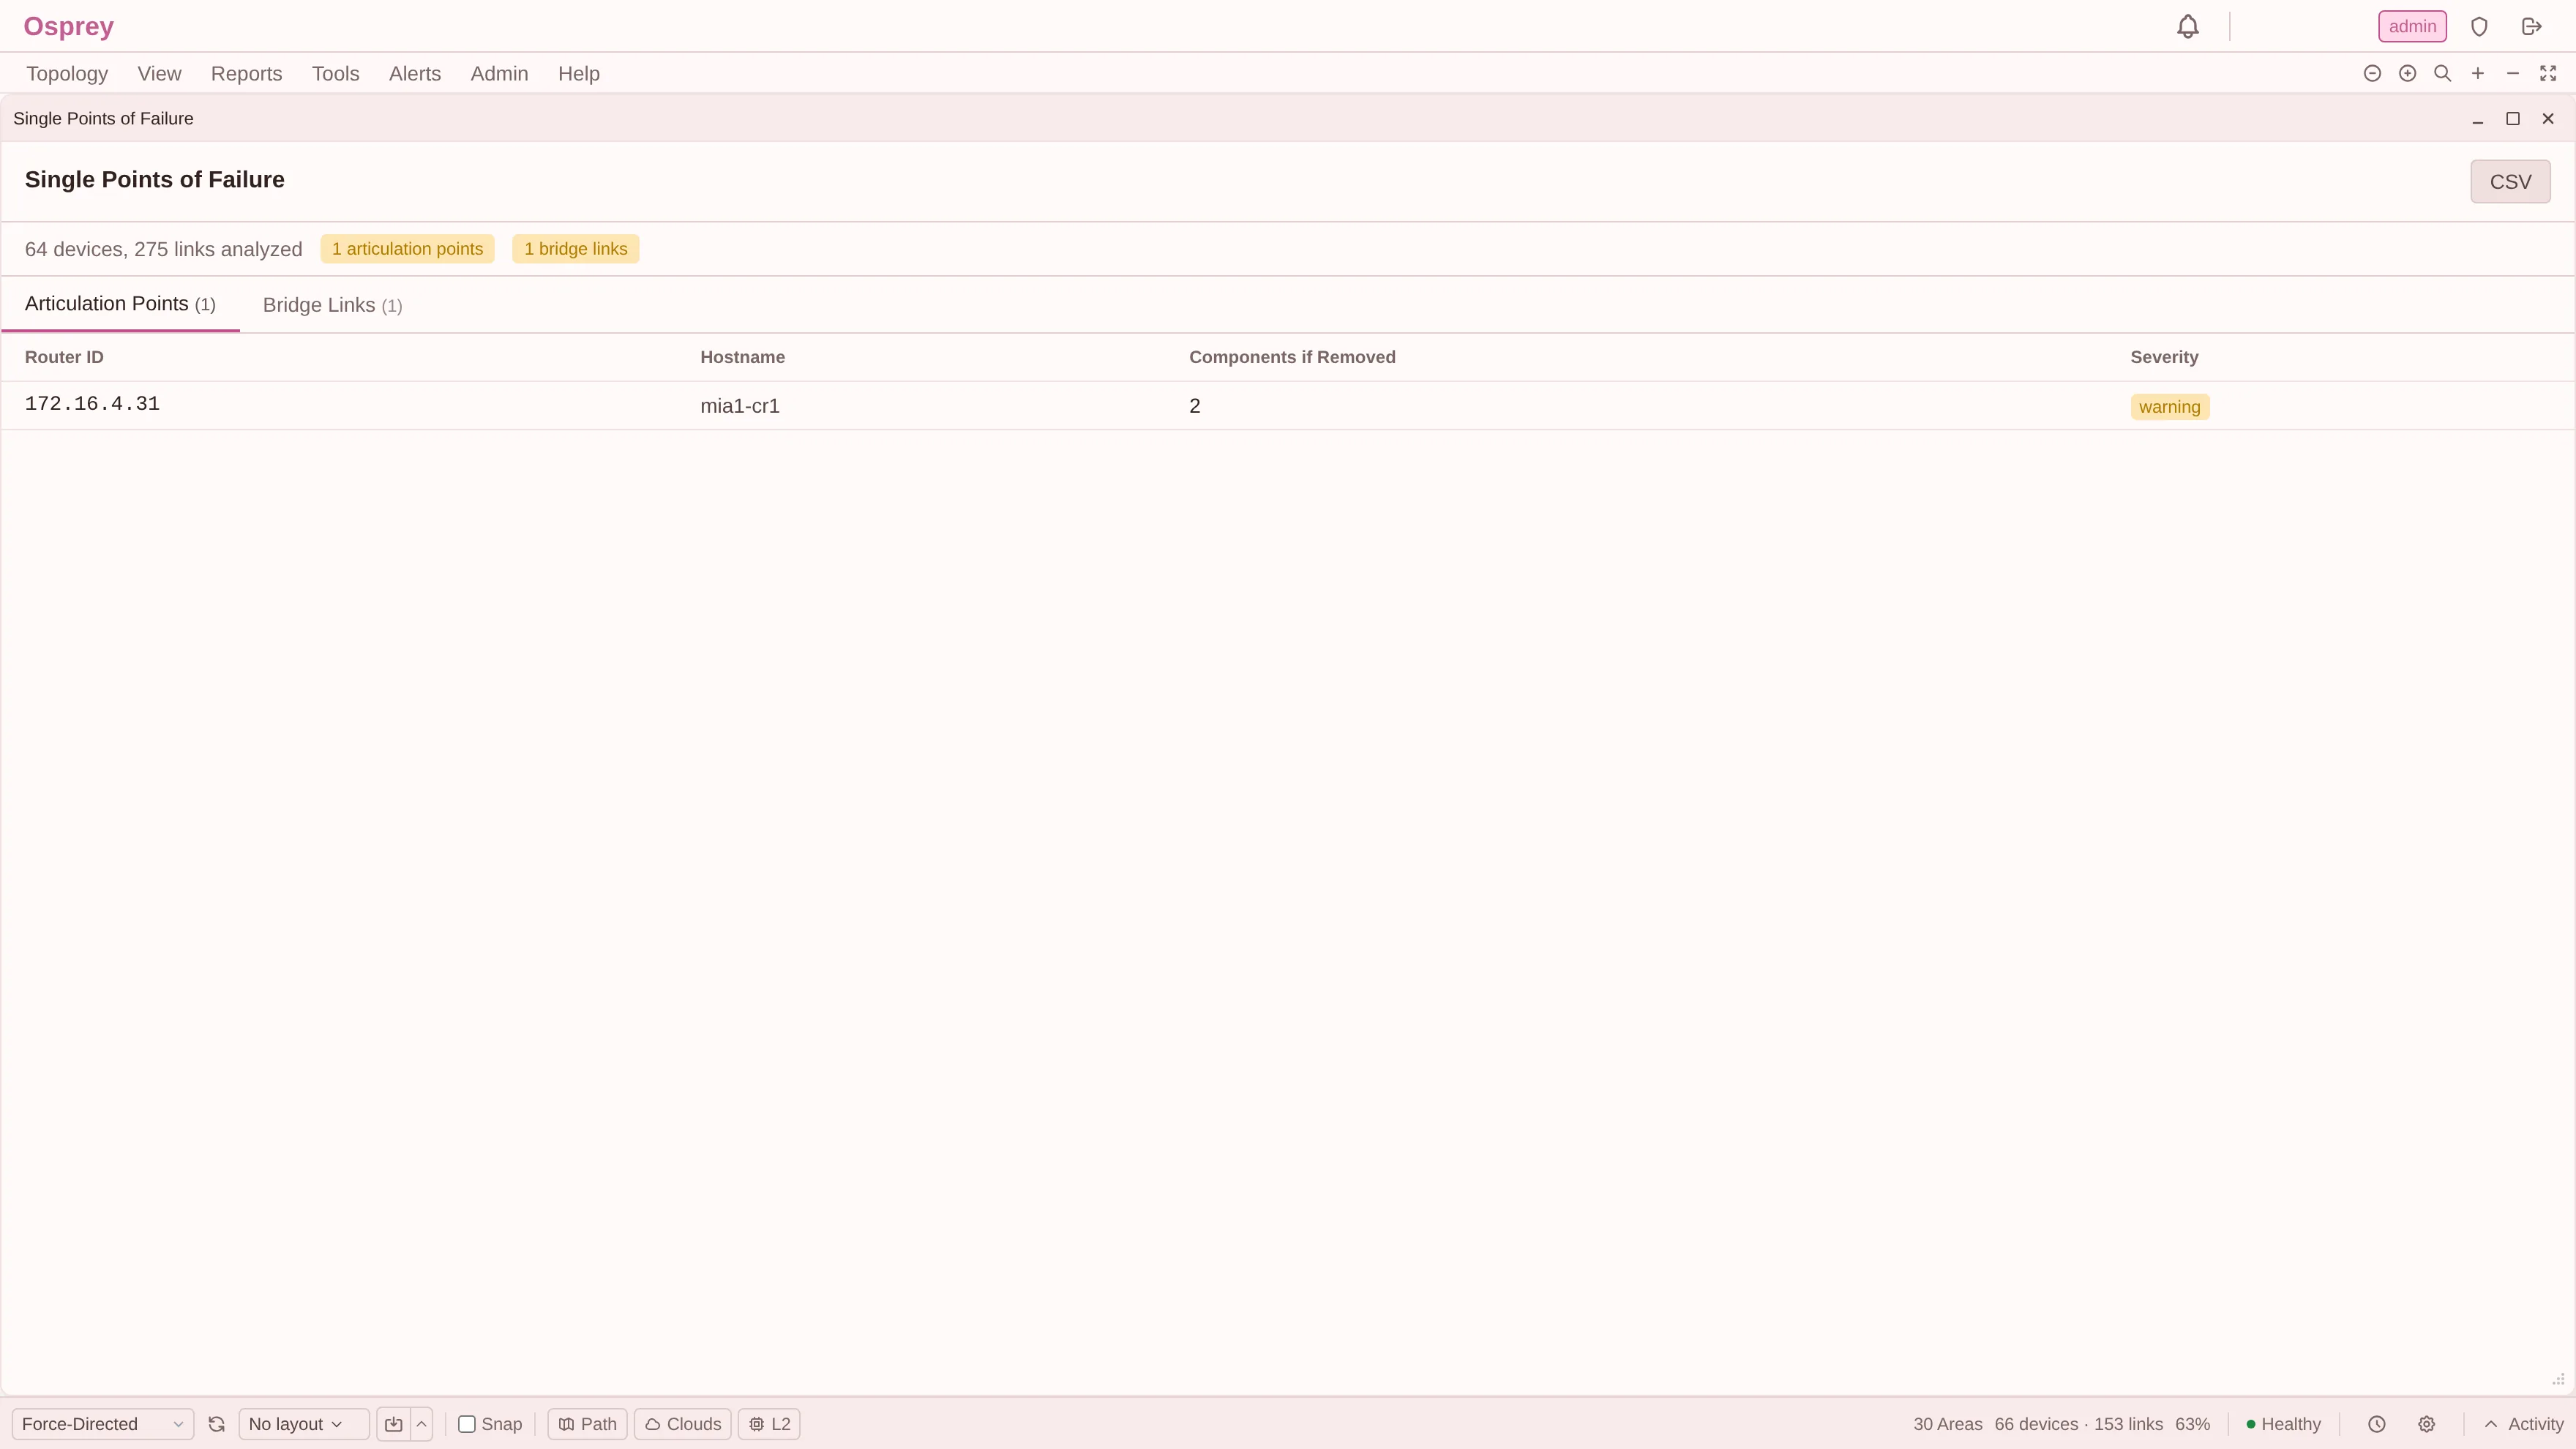
64 devices, 275 links analysed, 1 articulation point (mia1-cr1, 172.16.4.31)
and 1 bridge link. An articulation point is a vertex whose removal increases the
number of connected components, the graph-theoretic name for “if this router dies,
the network splits”.
Here is the part I did not plan and like the most. I ran the same report against the other two tenants:
| Tenant | IGP | Articulation point | Bridge link |
|---|---|---|---|
| Harrier-Broadband | OSPFv2 | mia1-cr1 | mia1-cr1 ↔ mia1-gw1 |
| Kestrel-Dynamics | EIGRP | e-mia1-cr1 | e-mia1-cr1 ↔ e-mia1-gw1 |
| Merlin-Carrier | IS-IS | i-mia1-cr1 | i-mia1-cr1 ↔ i-mia1-gw1 |
Three carriers. Three different IGPs. Three completely separate discovery paths:
OSPF LSDB walks, CISCO-EIGRP-MIB neighbour tables, IS-IS LSPs. The same structural
weakness in each, in the same place.
The honest explanation is that I built the lab from a template and gave Miami a
single-homed gateway three times. But that is exactly what makes it a useful check:
the same physical mistake, described to Osprey through three unrelated protocol
models, produced the same three answers. If the IS-IS topology extraction had a bug
in it, i-mia1-cr1 is where the disagreement would have shown up.
I did not know that was in the lab until the tool told me. It had been there for weeks, in a lab I built specifically to catch things.
That is the part worth separating from the graph theory, because the theory is the unremarkable half. Articulation points and bridges are textbook, and any tool can compute them over any drawing. What decides whether the answer means anything is what the vertices and edges are. Osprey’s graph is not a diagram somebody maintained: it is reconstructed from what the routers themselves flood, so a bridge in it is a statement about forwarding rather than about a picture. Run the same algorithm over a stale Visio file and you get the same shapes and none of the truth.
Why the answer arrives before you let go of the mouse
Thirteen milliseconds for 275 failure scenarios is not the result of clever parallelism. It is the result of not doing the work.
A link whose removal disconnects a graph is a bridge: an edge that lies on no cycle. Tarjan’s bridge-finding algorithm identifies every one of them in a single depth-first traversal, O(V+E), for the whole graph at once. And a link that is not a bridge cannot possibly isolate anything: by definition it sits on a cycle, so there is another way around.
So the assessment finds the bridges first, and only simulates those:
// Precompute bridges in O(V+E). These are the only links that can
// cause unreachable devices when removed.
bridgeLinks := spf.FindBridges(baselineMerged)
Then it removes one more class. If two routers are joined by several parallel links, none of them can be a bridge in the sense that matters, because failing one leaves the others:
// Parallel links: if a device pair has multiple links, failing any one
// cannot disconnect them. Remove such links from the bridge set.
274 links are eliminated by a theorem rather than by a reachability check. One link gets simulated. That is the whole trick, and it is why the answer arrives before you have let go of the mouse. On a network a hundred times this size it is still one traversal plus a handful of checks.
Graph theory is not decoration here. It is the difference between a report you run and a report you glance at.
What “critical” means when nothing is critical
The Critical Pairs tab answers a question one step further out: which two links, neither of which is a single point of failure, are fatal together?
That is a genuinely nasty class of risk. Neither link shows up in any SPOF report. Neither one alone does anything. Take both (the same conduit, the same card, the same maintenance window) and the network splits.
Finding them means, for every non-bridge edge, removing it and re-running bridge detection on what is left. It is O(L·(V+E)), and it is the most expensive thing in the report.
In all three tenants the answer is zero, and the panel says so in words:
No critical link pairs detected — your topology has good redundancy.
A zero that took real work to compute is worth more than a long list. This one says: there is no pair of links in this network whose simultaneous loss partitions it, and that has been checked exhaustively rather than assumed.
Blast radius is not only topology
Structure is one kind of dependency. The other kind is reachability, and it is measured in address space:
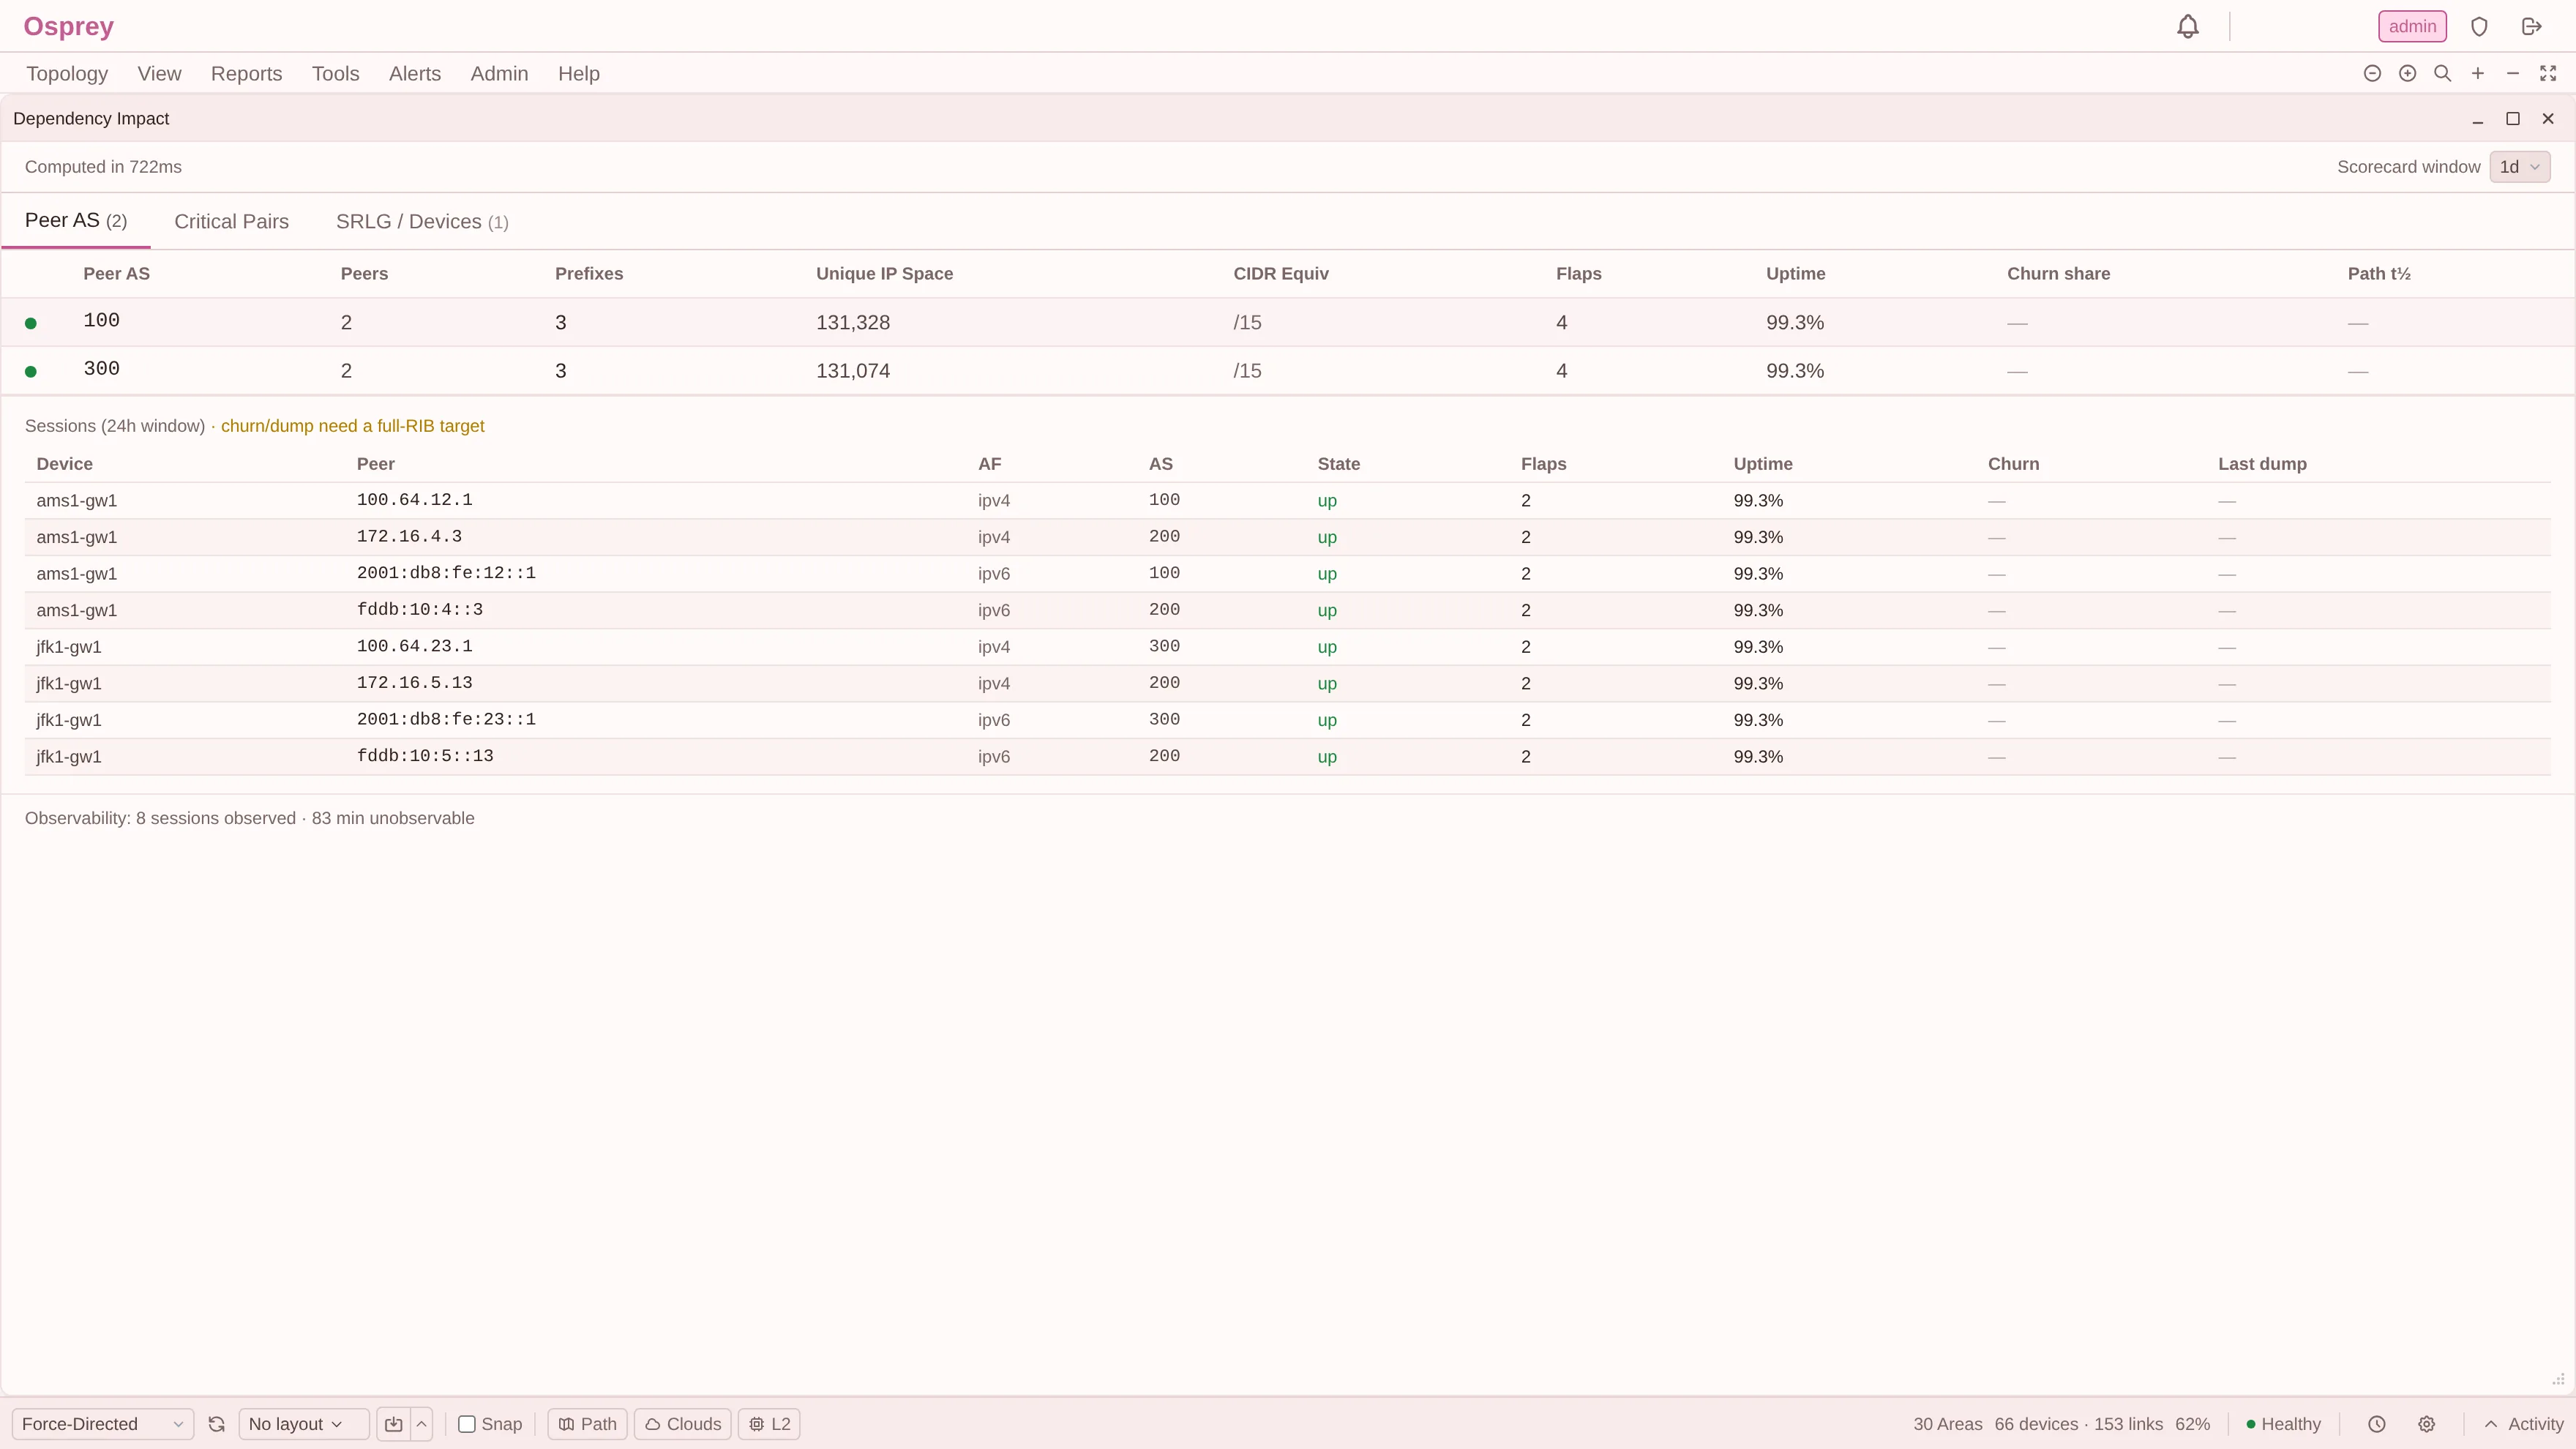
| Peer AS | Peers | Prefixes | IP space | CIDR equivalent |
|---|---|---|---|---|
| 100 | 2 | 3 | 131,328 | /15 |
| 300 | 2 | 3 | 131,074 | /15 |
Three prefixes does not sound like much until it is rendered as 131,328 addresses, a /15-equivalent, reachable only through AS 100. Prefix counts are a terrible proxy for exposure (one /15 and one /32 both count as “1”), so the report converts to address space and back to a CIDR equivalent, which is the unit an architect actually reasons in.
Alongside it, the report intersects each critical link pair with the SRLG groups its members belong to, so two links that look independent on the map but share a conduit are reported as correlated rather than diverse.
Which brings me to the gap I would rather state than have you find.
The part that is honest and unfinished
Osprey’s SRLG support is complete in every direction but one. You can define groups, attach links, fail an entire group as a single simulation mutation, and see shared-risk correlation in the dependency report. What you cannot do is discover them.
Nothing feeds the SRLG table. Every group is hand-entered. Osprey stores the RFC 5305 traffic-engineering sub-TLVs it sees in IS-IS as raw bytes but does not yet decode the SRLG sub-TLV, so a network that already advertises its shared-risk groups in its IGP gets no benefit.
The consumer was built before the source. That is the wrong order, it is on the roadmap, and until it is done the honest description of the feature is “SRLG simulation, from groups you tell it about”, not “SRLG discovery”.
I would rather write that sentence than let someone discover it during an evaluation.
Why this is the report I would run first
If I inherited a network tomorrow, the first thing I would want is not a map. It is the answer to three questions:
- Which single failures actually isolate something? (One link. One router.)
- Which pairs of failures do, that no single-failure report would show? (None: verified, not assumed.)
- How much address space sits behind each external dependency? (A /15 per peer AS.)
All three are computable from a model that is already correct, in well under a second, without touching a router. That is the entire argument for spending four posts on getting the model right first: an accurate model is not the product, it is the substrate the useful questions run on.
Next: the number this post quietly avoided. How much traffic actually moves when that link fails, and why my lab cannot tell me. Estimating What You Cannot Measure.