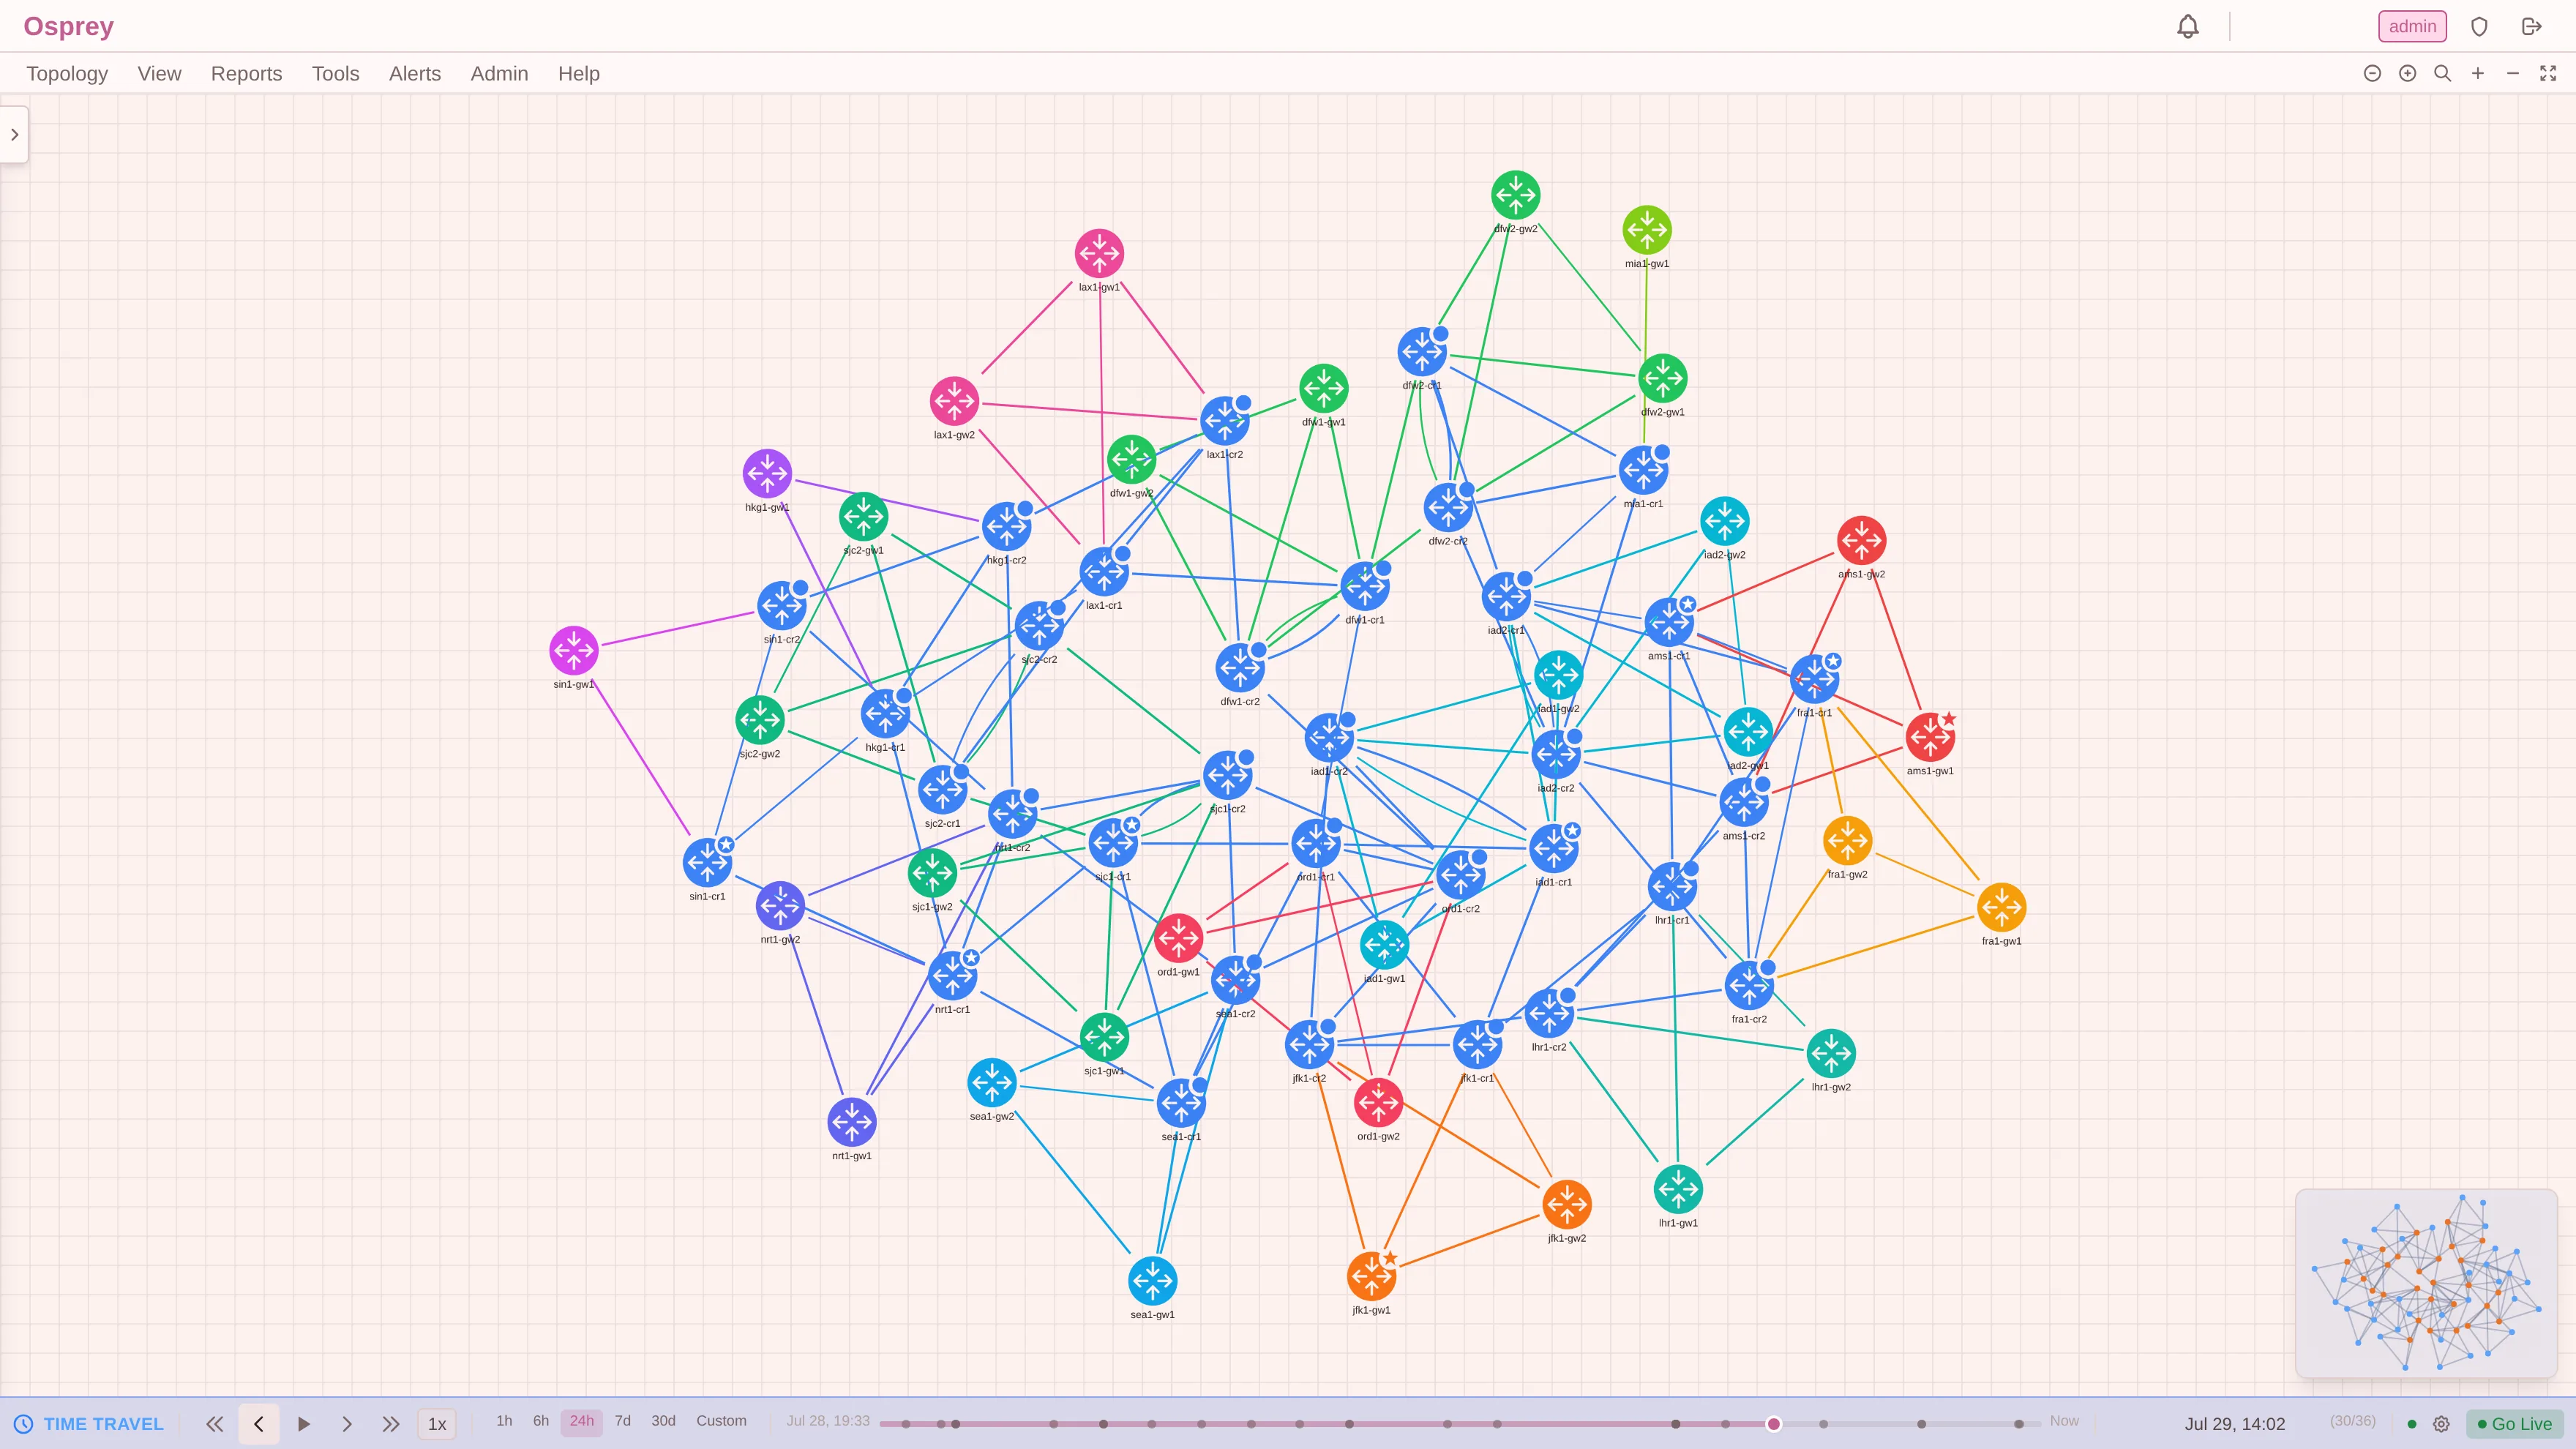
See your network.
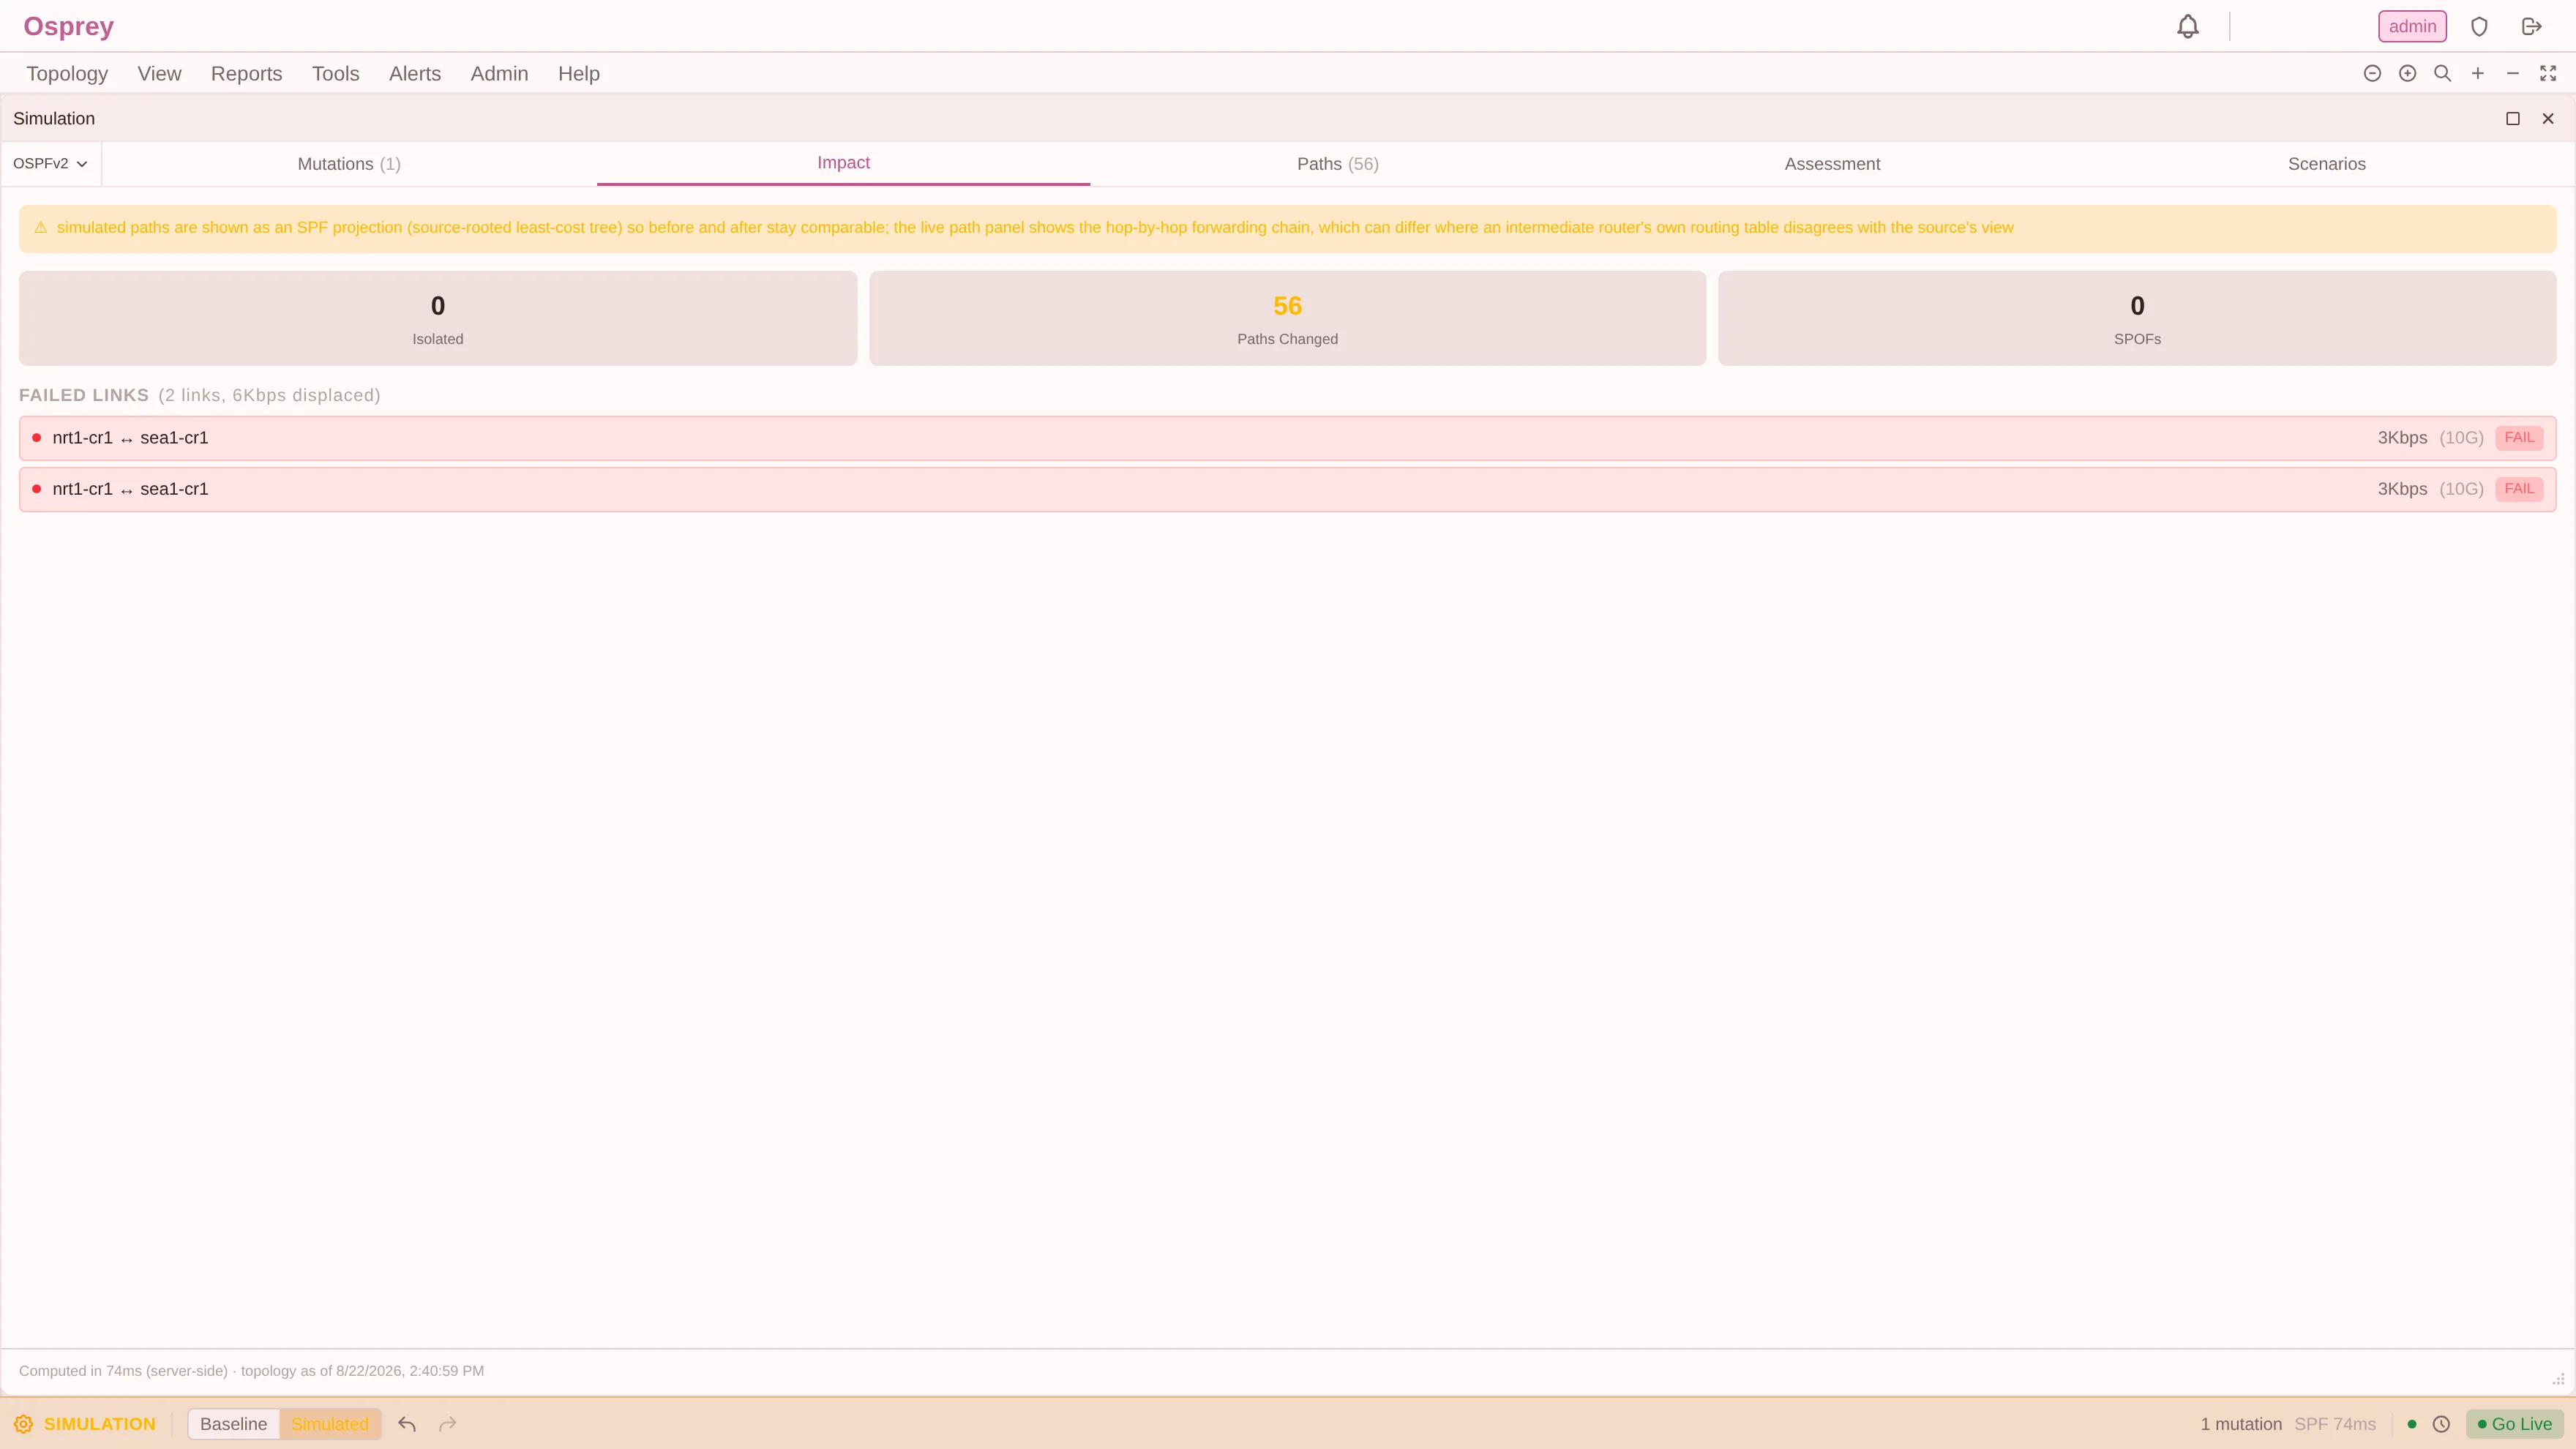
Simulate before you change it.
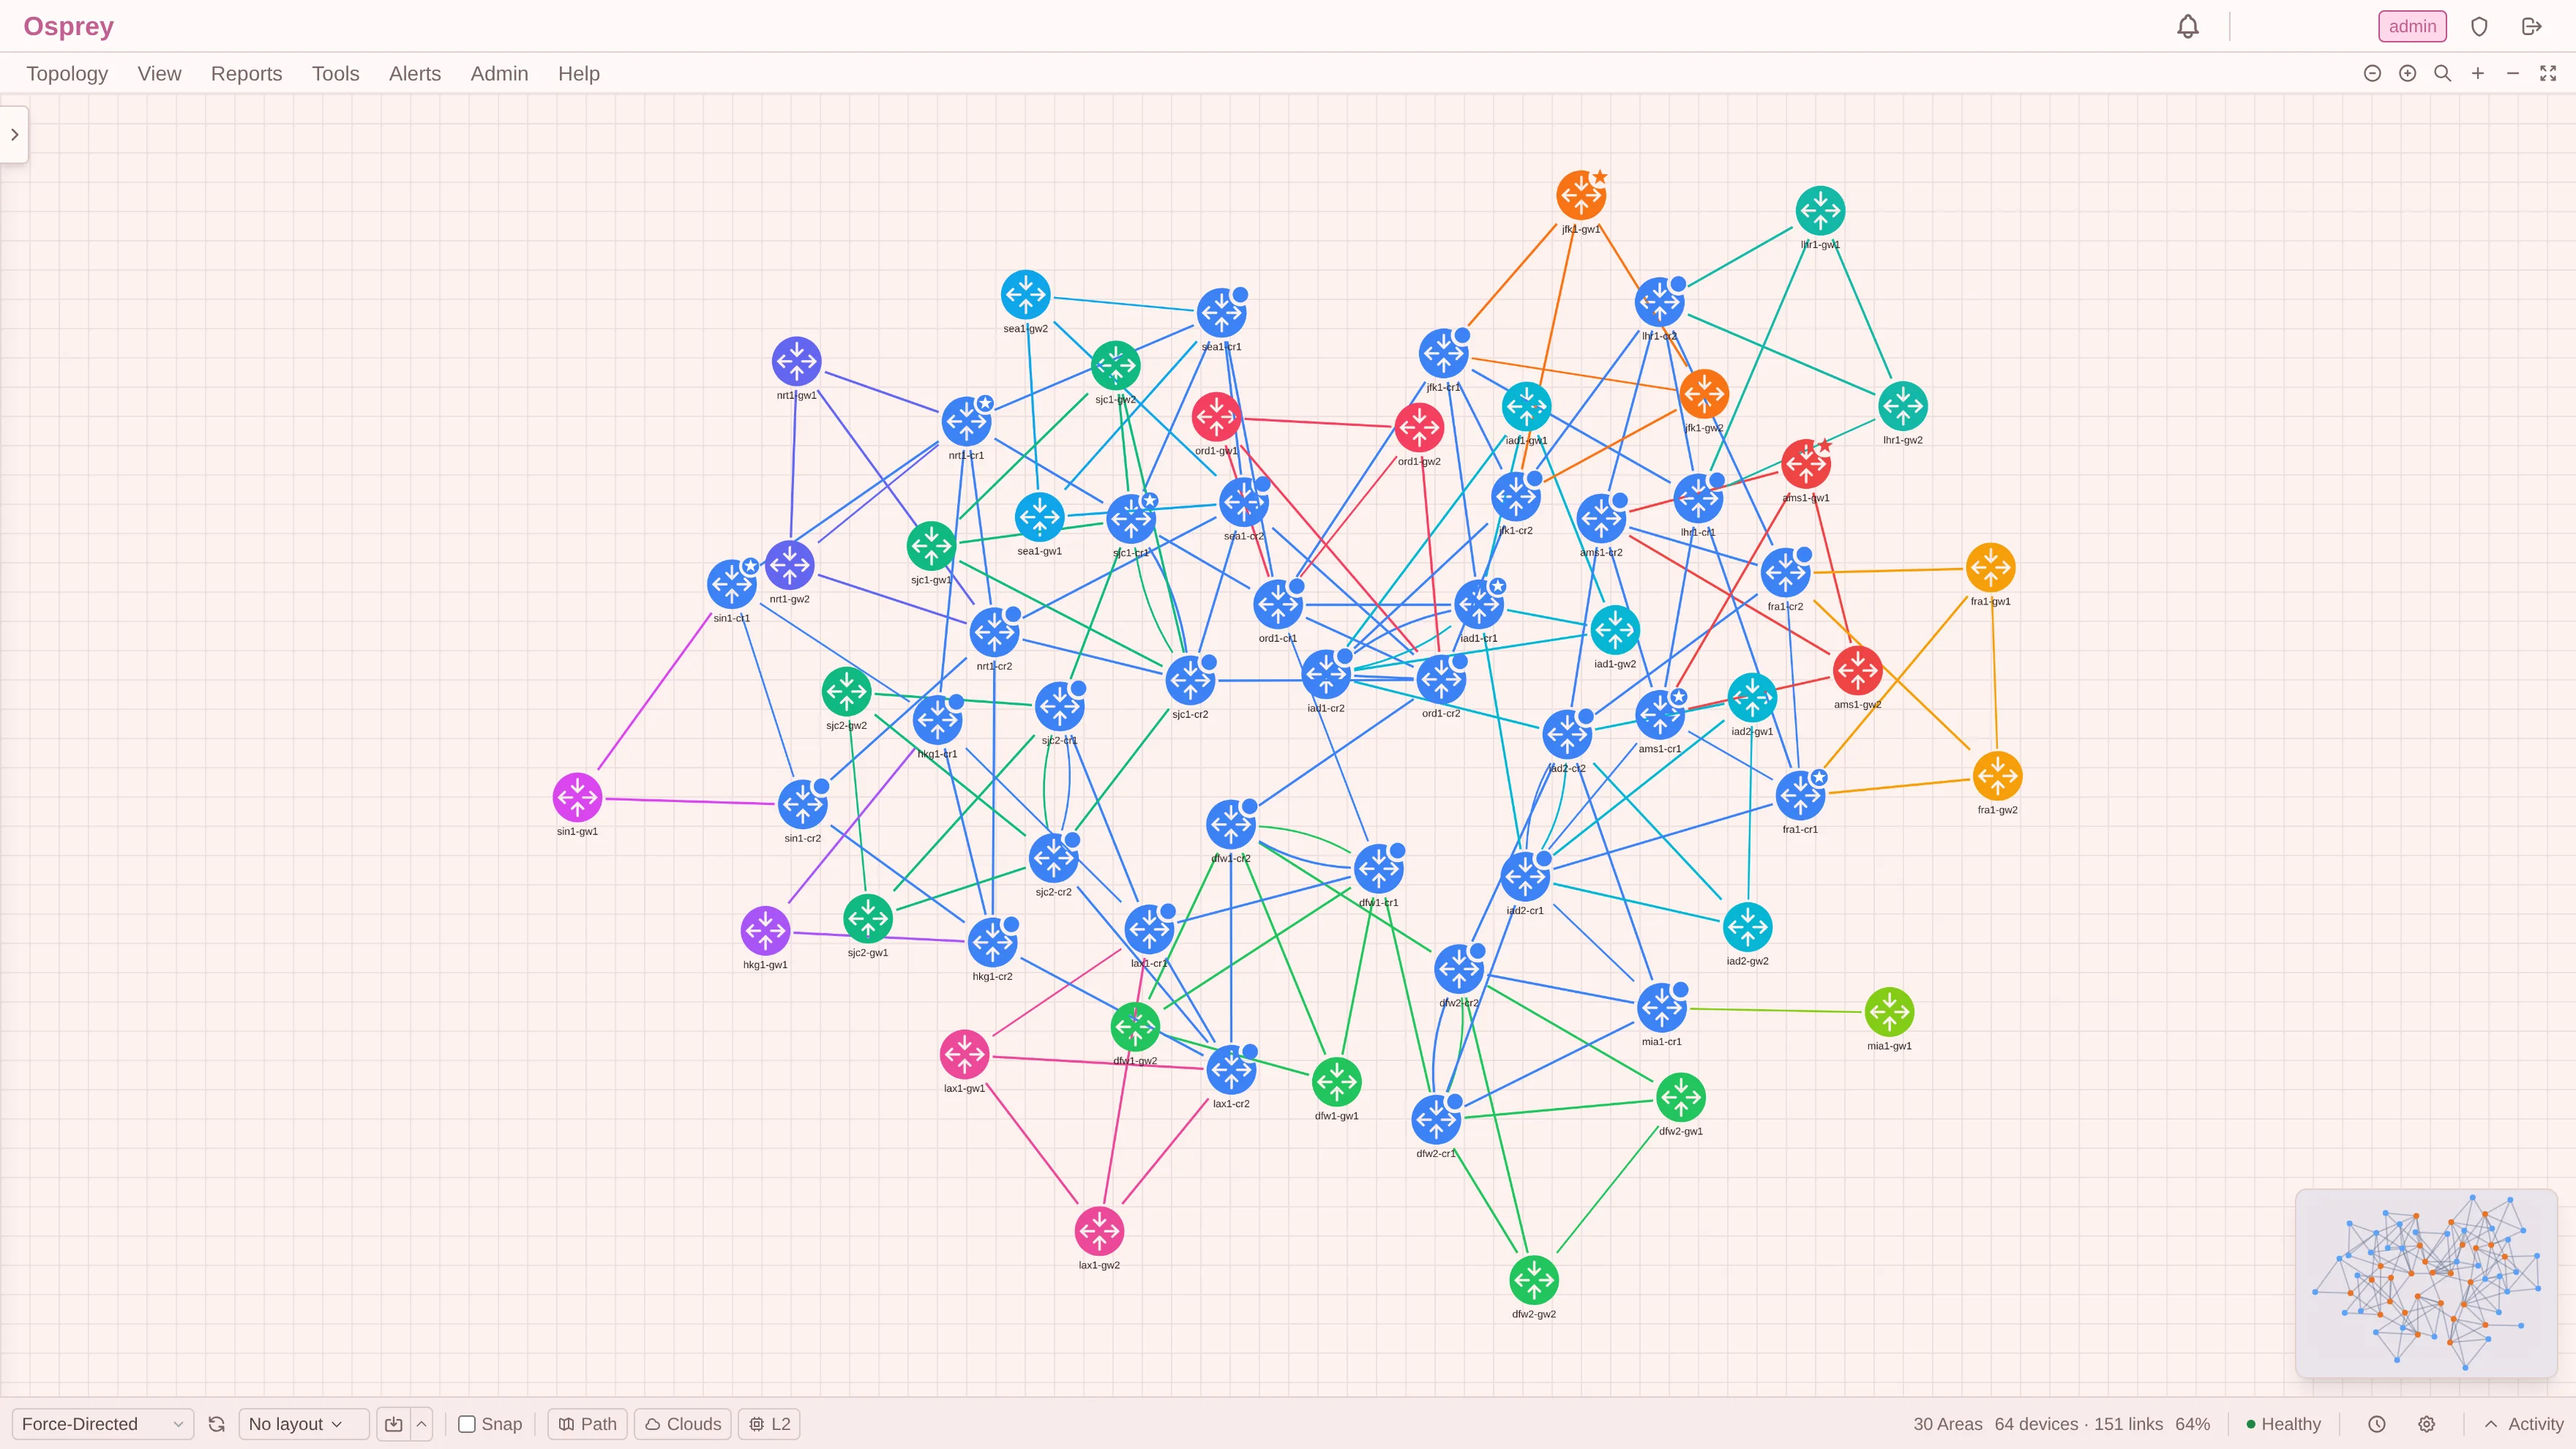
Osprey is a real-time visibility and engineering platform for OSPF, IS-IS, EIGRP, BGP, MPLS, and EVPN networks. Live topology, service overlays, what-if simulation, time travel, and diagnostics — all passive, all from one web UI.
- ▶ Multi-protocol discovery
OSPFv2, OSPFv3, and IS-IS via GRE or SNMP. EIGRP read passively over SNMP. BGP and EVPN via BMP. MPLS-TE, L3VPN, and pseudowires via SNMP. Layer 2 via LLDP/CDP.
- ▶ What-if simulation
Fail links, change costs, add hypothetical routers — server-side Dijkstra, no production impact.
- ▶ Time travel — topology and BGP
Scrub back through history — including real as-of-that-moment BGP best-paths and peer sessions.
- ▶ Path analysis — even across ASes
Hop-by-hop forwarding chains taken from each router's own routing table, asymmetric detection, SR-MPLS label stacks, and cross-domain paths stitched along the BGP AS chain.
- ▶ BGP AS-Flow animation
Watch the inter-AS graph reflow on a timeline — animated flows, movers diff, per-AS drill-down, per-prefix replay.
- ▶ Incident correlation & alerts
Related events collapse into incidents. Notify via Slack, Teams, email, webhook, or in-app.
Never injects routes or modifies your network
LSA, LSP, and BMP updates stream in live
OSPF, IS-IS, EIGRP, BGP, MPLS, EVPN, and L2 on one canvas
Pre-validate changes before you touch prod
Single binary, PostgreSQL — no JVM, no ES
Vendor-agnostic. Your data stays with you.
Everything you need to operate a modern IP network
From discovery to simulation to post-incident analysis — one tool, one interface.
Live Topology Canvas
Interactive graph with real-time push updates. Five layout algorithms (force-directed, clustered by area, geometric, octilinear, circle), saveable layouts, snap-to-grid, minimap, and area boundary overlays. Large multi-area networks collapse into an area-cloud overview you expand in place. Changes flash on the canvas the moment they happen.
IGP Discovery — OSPF & IS-IS
OSPFv2, OSPFv3 (IPv4 + IPv6 address families), and IS-IS (L1/L2, CLNS + IPv4 + IPv6) with full LSDB/LSP visibility. Two discovery modes per protocol: GRE tunnels for real-time adjacencies (IPv4 or IPv6 underlay, OSPF and IS-IS authentication), or SNMP polling — one seed device can crawl an entire multi-area domain. Multi-protocol devices are auto-correlated across OSPF and IS-IS.
EIGRP — Passive & Read-Only
EIGRP has no link-state database to join, so Osprey reads it entirely passively over SNMP on Cisco platforms: neighbours and interface state, IPv4 and IPv6, classic and named mode, per VRF and AS. Adjacencies are stitched into the topology alongside your OSPF and IS-IS areas, and paths follow each router's installed successor with its real composite metric — the routers' own decision, read back, never a borrowed cost or a guess.
BGP Visibility via BMP
Passive BMP server (RFC 7854) receives peer state and RIB updates from your routers — no polling. Full RIB per prefix across every target: all paths, ADD-PATH, and engine-computed best-path selection, like show ip bgp network-wide. Search with exact, longest-match, or covered prefix modes; ECMP and AS-path analysis. Sessions on routers that can't export BMP are discovered via SNMP.
MPLS Visibility — TE, L3VPN, L2VPN
MPLS-TE tunnels (RFC 3812), L3VPNs (RFC 4364) with VRFs rolled up by route-target and classified full-mesh or hub-and-spoke, and L2VPN pseudowires rolled up into VPWS wires and VPLS instances — discovered via SNMP inside the normal poll cycle. Overlays draw service membership on the canvas, honestly labelled as control plane, never a guessed data path.
EVPN Visibility
EVPN instances (RFC 7432) discovered straight from the BGP control plane via the same BMP feed — zero extra configuration. E-LAN and EVPN-VPWS services, VXLAN or MPLS encapsulation, per-PE MAC/IP counts, and Ethernet Segments. MAC mobility and PE loss surface as correlated incident symptoms, storm-guarded.
Engineering Mode (What-If)
Simulate link or node failures, change metrics, add hypothetical routers and links, and model SRLG failure groups. Server-side multi-area Dijkstra (OSPF) and multi-level Dijkstra (IS-IS). Batch-assess every link or node to find your weakest points. Save scenarios. Combine with time travel to test past outages.
L2 Discovery — LLDP & CDP
Auto-discovery of Layer 2 adjacencies via SNMP walks of LLDP-MIB and CDP-MIB. Switch crawling with BFS, platform-based filtering (excludes APs and phones), and a toggleable L2 overlay on the canvas. Per-network credential overrides.
SNMP Traffic Monitoring
Interface counters drive utilization heatmaps, per-interface sparklines, and congestion alerts. Automatic 10-second boost polling while detail panels are open. MRTG-style historical charts over 24h, 7d, 30d, or 1y. Credential profiles for reuse across targets.
Time Travel
Scrub back through topology history with a timeline slider and transport controls (0.5×–10×). Node panels, link panels, SPF trees, and path simulation all adapt to the historical state — including real as-of-that-moment BGP best-paths and peer sessions, never live data mislabelled as historical. Hash-deduplicated snapshots keep storage efficient.
BGP AS-Flow & Change Replay
An animated inter-AS graph: autonomous systems are sized bubbles, AS-path adjacencies are animated flows. Scrub the timeline, play the reflow, diff two instants with a movers view, and drill into any AS for share, churn, sole-path dependency, exit routers, and session health. Replay any single prefix's best-path history step by step — full-table safe.
Path Analysis — Within & Across ASes
Every hop is that router's own routing-table decision — the chain a packet actually walks, not a source-rooted shortest path — with per-hop metric, route type (O, O IA, E1/E2, I L1, I L2), and the full installed equal-cost set. Forward and reverse costs, asymmetric routing detection, CLNS traceroute, and SR-MPLS label stacks — administrative-distance-correct across protocols. Endpoints in different ASes or tenants? The path is stitched from IGP segments along the BGP AS chain, each with its own cost and confidence, with eBGP transitions drawn on the canvas — down to provable physical port pairs and shared switch fabrics. Failed-path diagnostics explain why a path can't be computed.
Alerting & Incidents
Rule engine with templates for congestion, interface errors, and SNMP failures. Event correlation groups related failures into incidents with inferred root causes — including OSPF area partitions, detected and classified even though the protocol never signals them. Alerts auto-resolve on recovery. Deliver via Slack, Teams, email, webhook, or in-app. Maintenance windows suppress alerts during planned work.
SSH Terminal
Right-click any device on the canvas to open a browser-based SSH session. Host key verification, AES-256 encrypted session recording, and full audit logging. Telnet fallback available but disabled by default.
Diagnostics
Topology health, IP conflicts, single points of failure (articulation points and bridge links), routing stability, congestion trend, OSPF + IS-IS timer consistency (pairwise mismatches and consistent-but-nondefault timers), MTU mismatch, OSPF best practices, and dependency impact analysis (Peer AS, critical pairs, SRLG). All with CSV export.
Visio, SVG & PNG Export
Native Visio (.vsdx) export with A4 landscape layout, title block, and legend. Import custom icon packs from Visio stencils (.vssx) — Cisco, Juniper, Arista, Fortinet. Per-device icon overrides carry into exports. Selection-only export for extracting a site from a larger topology.
Operational visibility at a glance
The dashboard gives you a six-card overview of your entire network. The canvas lets you drill into every detail.
Dashboard
- ● Network Health — system status (healthy / degraded / unhealthy), device and link counts, collector and SNMP target status, with a 7-service health popover showing heartbeat freshness.
- ● Active Alerts — severity badges and top 5 firing alerts. Bell icon in the header shows live count with one-click acknowledge.
- ● Recent Events — 24-hour sparkline histogram and the 8 most recent topology events with color-coded type badges.
- ● Active Incidents — correlated incidents with severity, event counts, and inferred root causes.
- ● Network at a Glance — clickable list of all networks with per-network stats (areas, devices, links).
- ● Top Utilized Links — 5 busiest links across all networks with color-coded utilization bars.
Auto-refreshes every 30 seconds.
Canvas Interaction
- ● Panel Manager — up to 3 floating, draggable, resizable panels on screen at once and 16 tracked in total. Minimize to the pill bar without losing state. Keyboard shortcuts for every common action.
- ● Node & Link Detail — device info, neighbors, live traffic with 10-second boost polling, utilization history (24h / 7d / 30d), timer comparison, alerts, and recent events. Multi-protocol tabs when OSPF, IS-IS, or EIGRP share a wire.
- ● Color Modes — view by OSPF area or IS-IS level, metric cost gradient, or SNMP utilization heatmap.
- ● Service Overlays — select an L3VPN, VPWS wire, VPLS instance, EVPN instance, or TE tunnel to see its members and membership edges on the map, honestly labelled as control-plane knowledge.
- ● Twelve Themes — Dark, Midnight, Morning, Solarized, Gruvbox, Warm Slate, Miami, Horizon, Alphabet, Daylight, Sakura, and High Contrast (WCAG AAA). Canvas and SSH terminal both adapt.
- ● Find Device — Ctrl+K search across router IDs, hostnames, DNS, IPs, interface descriptions, and CIDR subnets.
Comprehensive reports
Inventory, routing analysis, and diagnostics — all searchable (text or regex), sortable, and exportable to CSV.
Inventory
- Routers — vendor, model, version, roles, areas / levels
- Links — endpoints, IPs, costs, state
- Interfaces — OSPF and IS-IS timers included
- Software Versions — fleet analysis by vendor, platform, or version
- CDP / LLDP Neighbours — unified L2 view
Routing & Services
- IGP Prefixes, Inter-Area & External Routes (E1/E2/NSSA)
- LSDB Browser — OSPF LSA tabs or IS-IS LSP view
- Neighbor Table — OSPF, IS-IS, and EIGRP adjacencies
- BGP Peers & Routes — exact / longest-match / covered
- BGP AS Flow — animated inter-AS graph over time
- EVPN Instances — E-LAN & EVPN-VPWS membership
- MPLS-TE Tunnels, L3VPNs, VPWS Wires & VPLS Instances
Diagnostics
- Topology Health — down links, asymmetric costs, isolated devices
- IP Conflicts — duplicate RIDs, IPs, prefixes, external conflicts
- SPOF — articulation points and bridge links
- Routing Stability — flapping links and unstable devices
- Congestion Trend — sustained high utilization with sparklines
- Timer Consistency, MTU Mismatch, Best Practices
- Dependency Impact — Peer AS, Critical Pairs, SRLG
Change Summary
Visual distribution of topology changes over 1h, 6h, 24h, 7d, or 30d. Device, link, and stub network additions, removals, and modifications with color-coded badges.
Topology Diff
Compare topology at two points in time. See what was added, removed, or changed across devices, links, and stub networks. Click any entry to highlight it on the canvas.
How it works
Install
One command: sudo apt install osprey. The installer configures all required services, generates secrets, runs database setup, and starts everything automatically. You're at the login screen in under a minute.
Connect
Create a network, add a protocol instance (OSPF, IS-IS, EIGRP, or BGP), and configure a GRE tunnel, SNMP target, or BMP session through the web UI. SNMP auto-crawl maps your entire IGP from a single seed device; MPLS services and EVPN are picked up automatically once SNMP and BMP are connected.
Operate
Watch your network live on the canvas. Pre-validate changes in Engineering Mode. Get alerts on adjacency changes and congestion. Run diagnostics. Travel back in time for post-incident analysis. SSH into devices without leaving the browser.
Enterprise-ready administration
Single sign-on, role-based access, encrypted credentials, audit logging, and portable backups.
Bring your own identity provider
Users are provisioned on first sign-in and their role follows your directory groups — no parallel user list to maintain. Two-factor authentication (TOTP) with one-time recovery codes covers local accounts, and a recovery command line gets you back in for the case where your IdP is the thing that's down. All of it is included in every licence, the free evaluation included.
OpenID Connect
Server-side Authorization Code flow with mandatory PKCE against Entra ID, Okta, Keycloak, or any OIDC-compliant provider.
LDAP / Active Directory
Directory accounts sign in through the normal login form. LDAPS or StartTLS, group membership via memberOf, group-search filters, and AD nested groups.
SAML 2.0
SP-initiated sign-on with a signed request and full assertion validation — signature, audience, expiry, and request binding, so unsolicited or replayed assertions are rejected.
SCIM 2.0 provisioning
Your IdP creates, updates, and deactivates Osprey accounts automatically (RFC 7644), authenticated by a dedicated, revocable token — not a cookie or an API key.
Role-Based Access
Three roles: admin (full control), engineer (monitoring config), operator (read-only). Password policy enforcement, account lockout protection.
Encrypted at Rest
SNMP credentials, notification secrets, and SSH recordings encrypted with AES-256-GCM. API responses always mask credentials. Secure session cookies.
Audit Log
Immutable record of every admin action with full detail. Filter by user, action, entity, time range. CSV export for compliance.
Backup & Restore
Configuration export (portable JSON) for migration, or full database backup for disaster recovery. Encryption key portability for cross-machine restores.
API Keys
Create API keys with scoped roles and optional expiration for scripts, monitoring integrations, and CI/CD pipelines.
Session Management
View active login sessions with IP, user agent, and activity status. Force-logout individual sessions or all sessions for a user.
Credential Profiles
Reusable SNMP v2c/v3 credential templates. Assign to multiple targets and collectors — no credential duplication.
Prometheus Metrics
Built-in metrics endpoints for every service. Integrate with your existing monitoring stack.
Single binary. Minimal dependencies.
Five services from a single binary. PostgreSQL for storage — no Java, no Elasticsearch, no graph database. Ships as a Debian package; runs in privileged and unprivileged LXC containers.
Topology, events, SPF, snapshots
REST, WebSocket, SSH proxy
GRE tunnels, IGP adjacencies
Discovery, traffic, L2, MPLS, EIGRP
BGP & EVPN peers and RIBs
Up and running in minutes
The Debian package handles everything: database, TLS certificates, reverse proxy, and service startup.
$ sudo apt install osprey Osprey installed successfully. Web UI: https://localhost/ Login: admin / admin Config: /etc/osprey/osprey.yaml Secrets: /etc/osprey/osprey.env Status: systemctl status osprey.target
Works on Debian 12 (Bookworm), Debian 13 (Trixie), and Ubuntu 24.04+.
Licensing
Start with a free evaluation — all features, no time limit. When you're ready to license production deployments, get in touch.
Free evaluation
Up to 32 devices, forever
- All features included
- No time limit
- No credit card
- Email support
Production licensing
Professional & Enterprise
- Scale beyond 32 devices
- Multi-tenant / multi-site
- Custom terms & integrations
- Priority support
Ready to see your network?
Install Osprey, connect a GRE tunnel, SNMP target, or BMP session, and have your full topology visualized in minutes.